NetLynxer Gallery
Real product screenshots: dashboard, topology, inventory, diagnostics and SSH terminal. Same image assets; copy reflects current scope (v2.2.0).
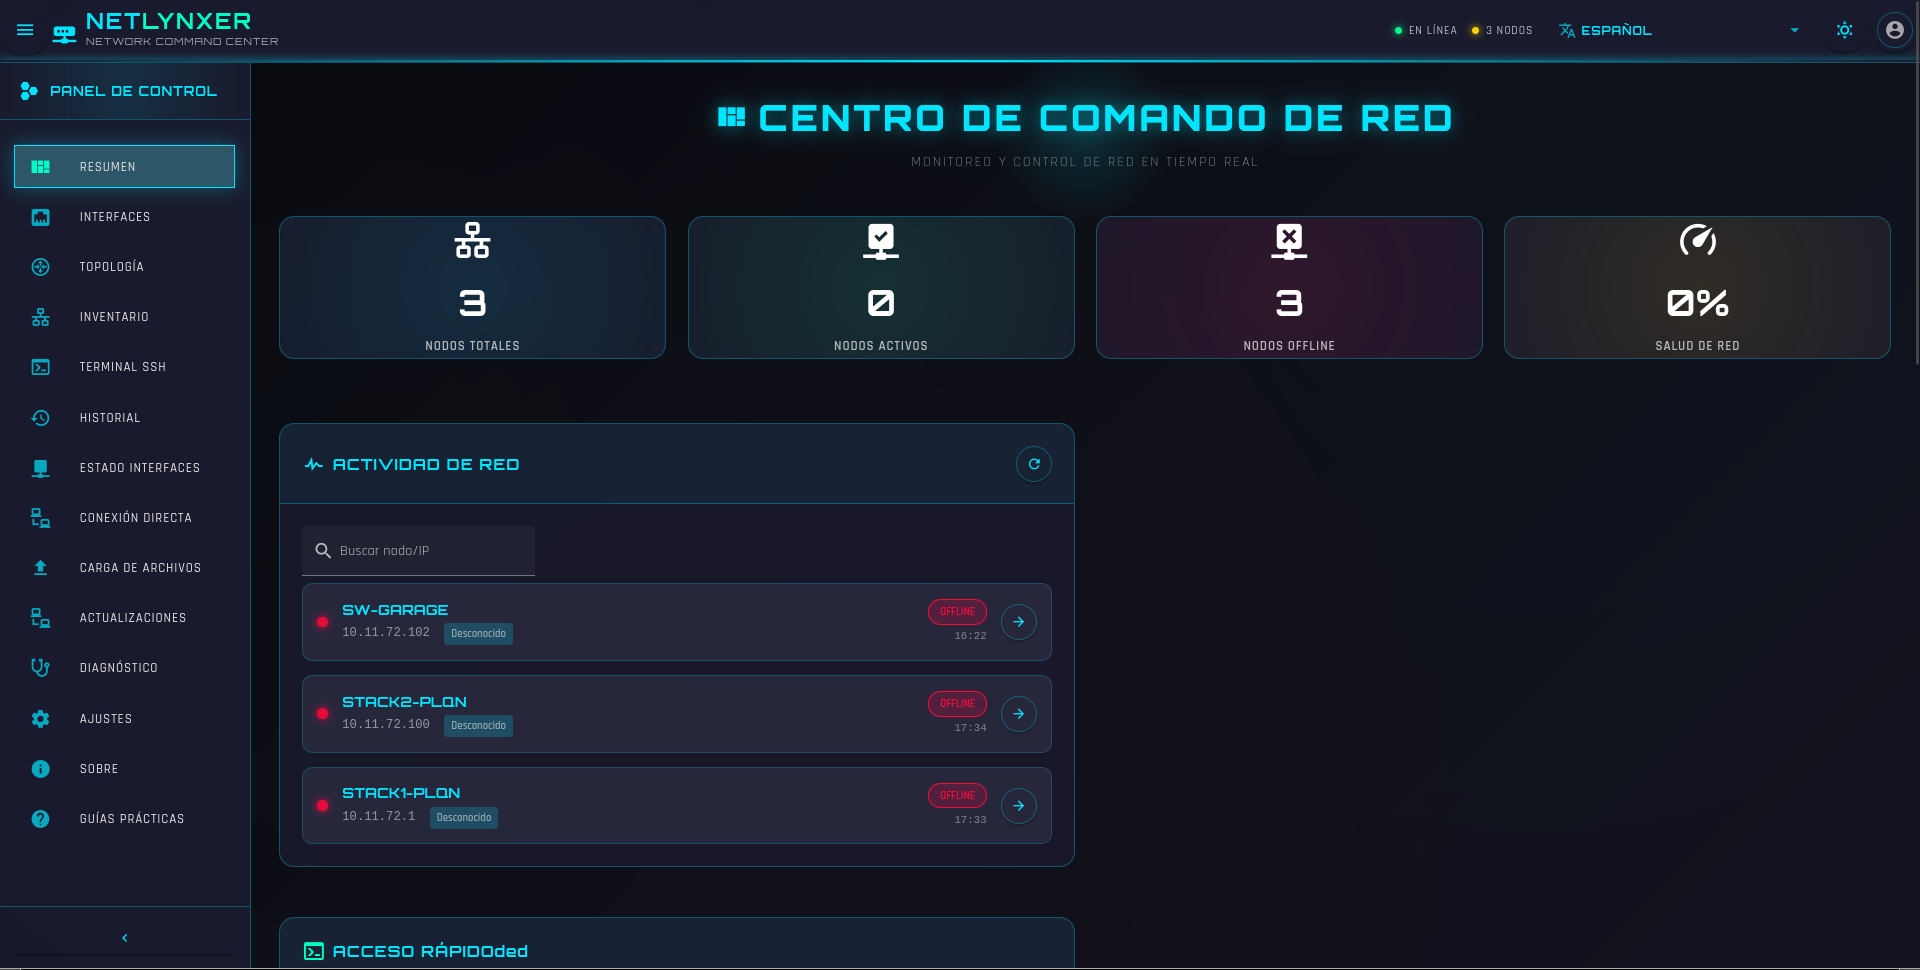
Main Dashboard
Overview: network health, devices and vendor diversity
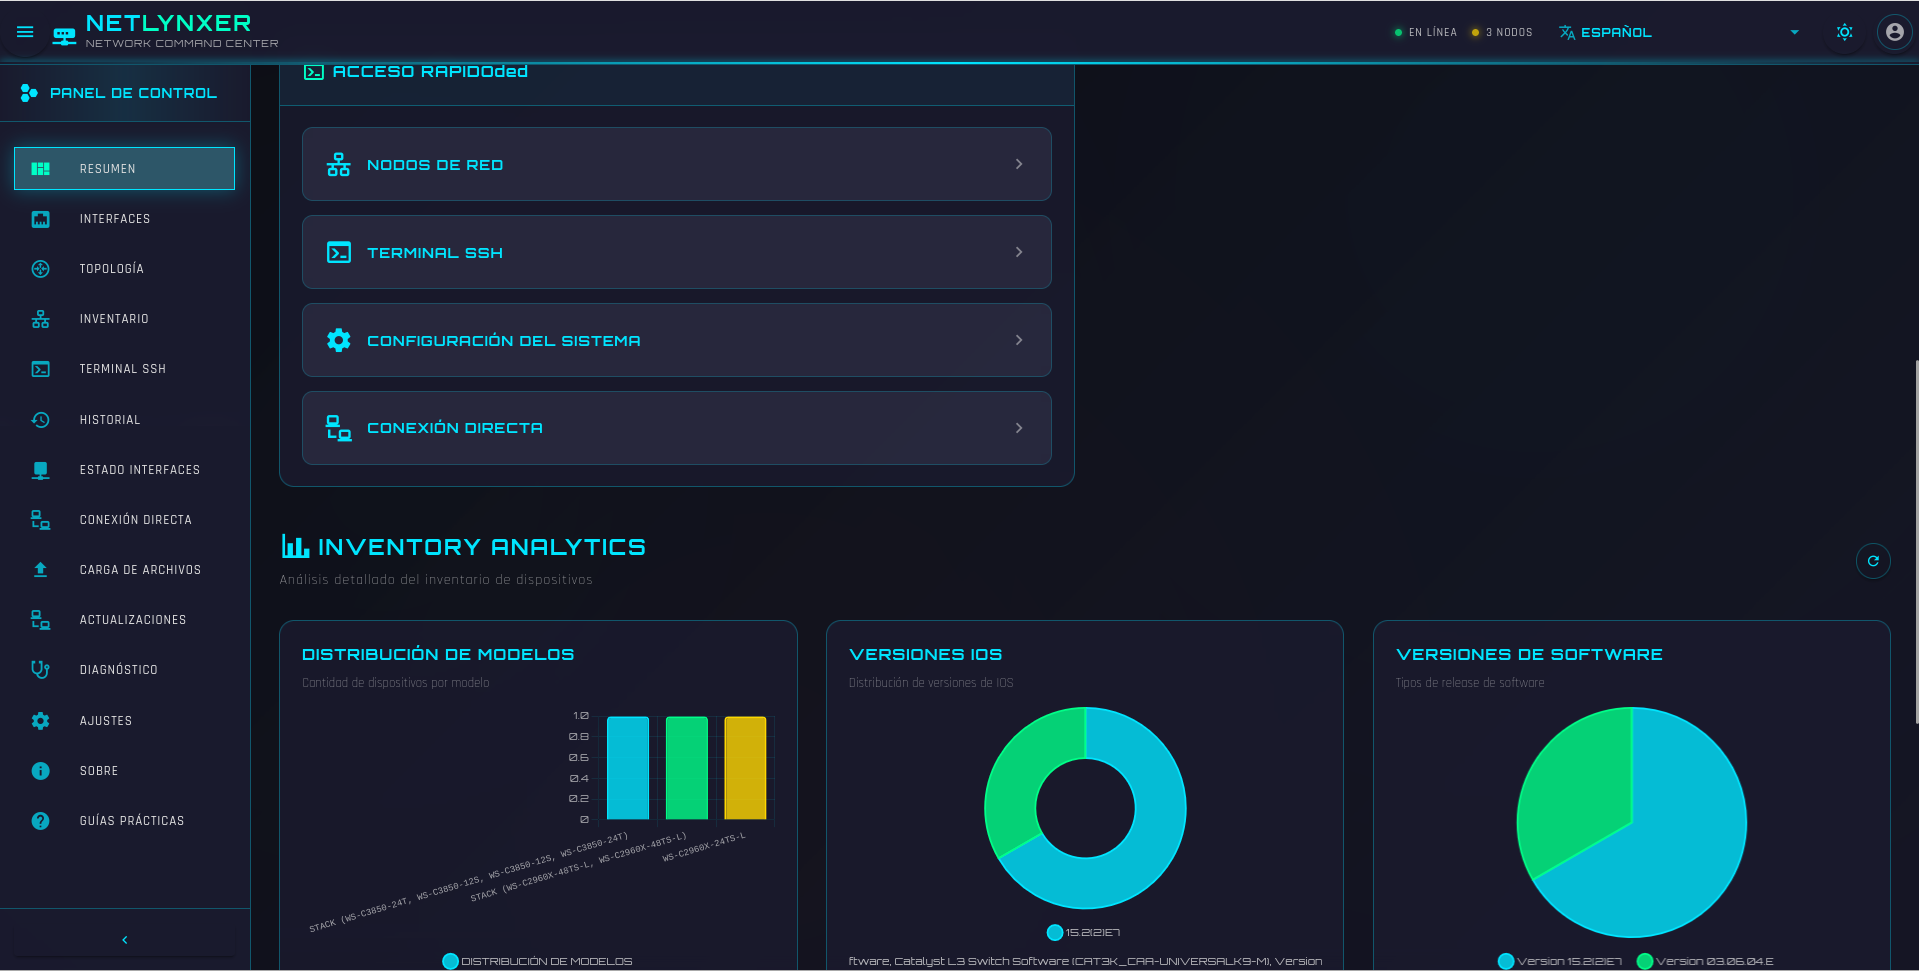
Metrics Dashboard
Polling views for performance and network statistics
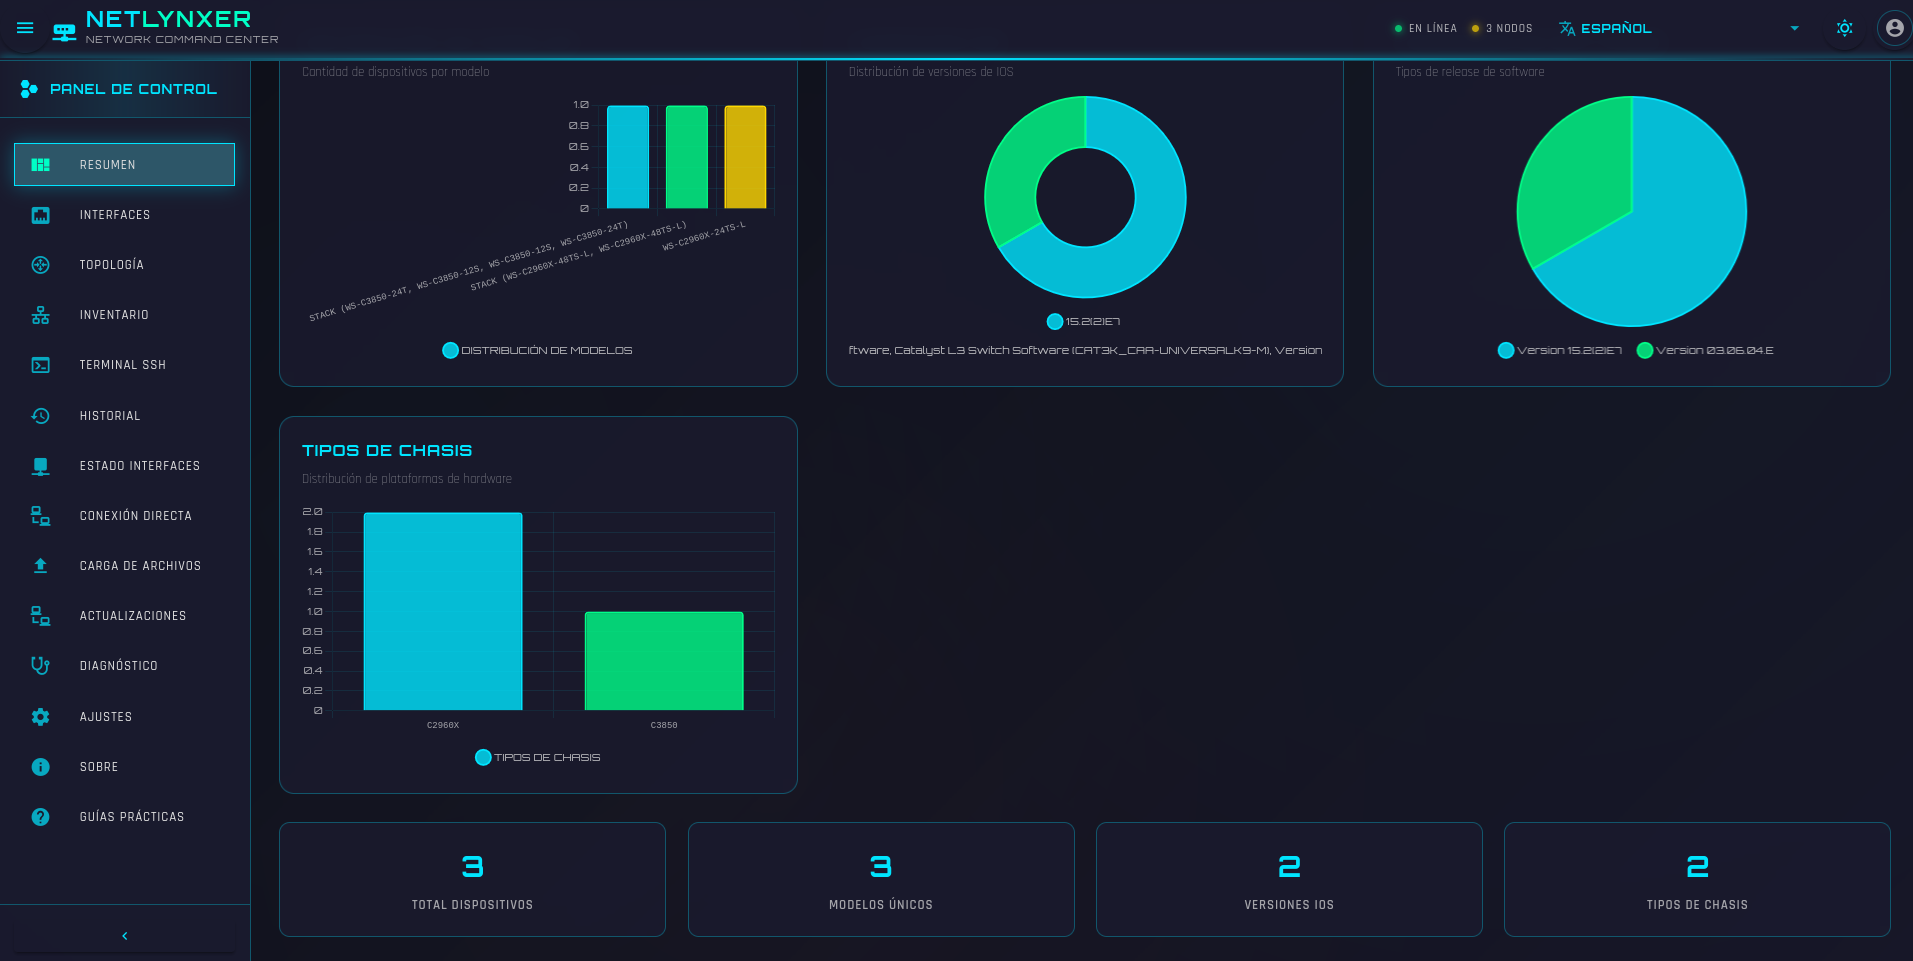
Inventory Statistics
Managed device inventory summary and status
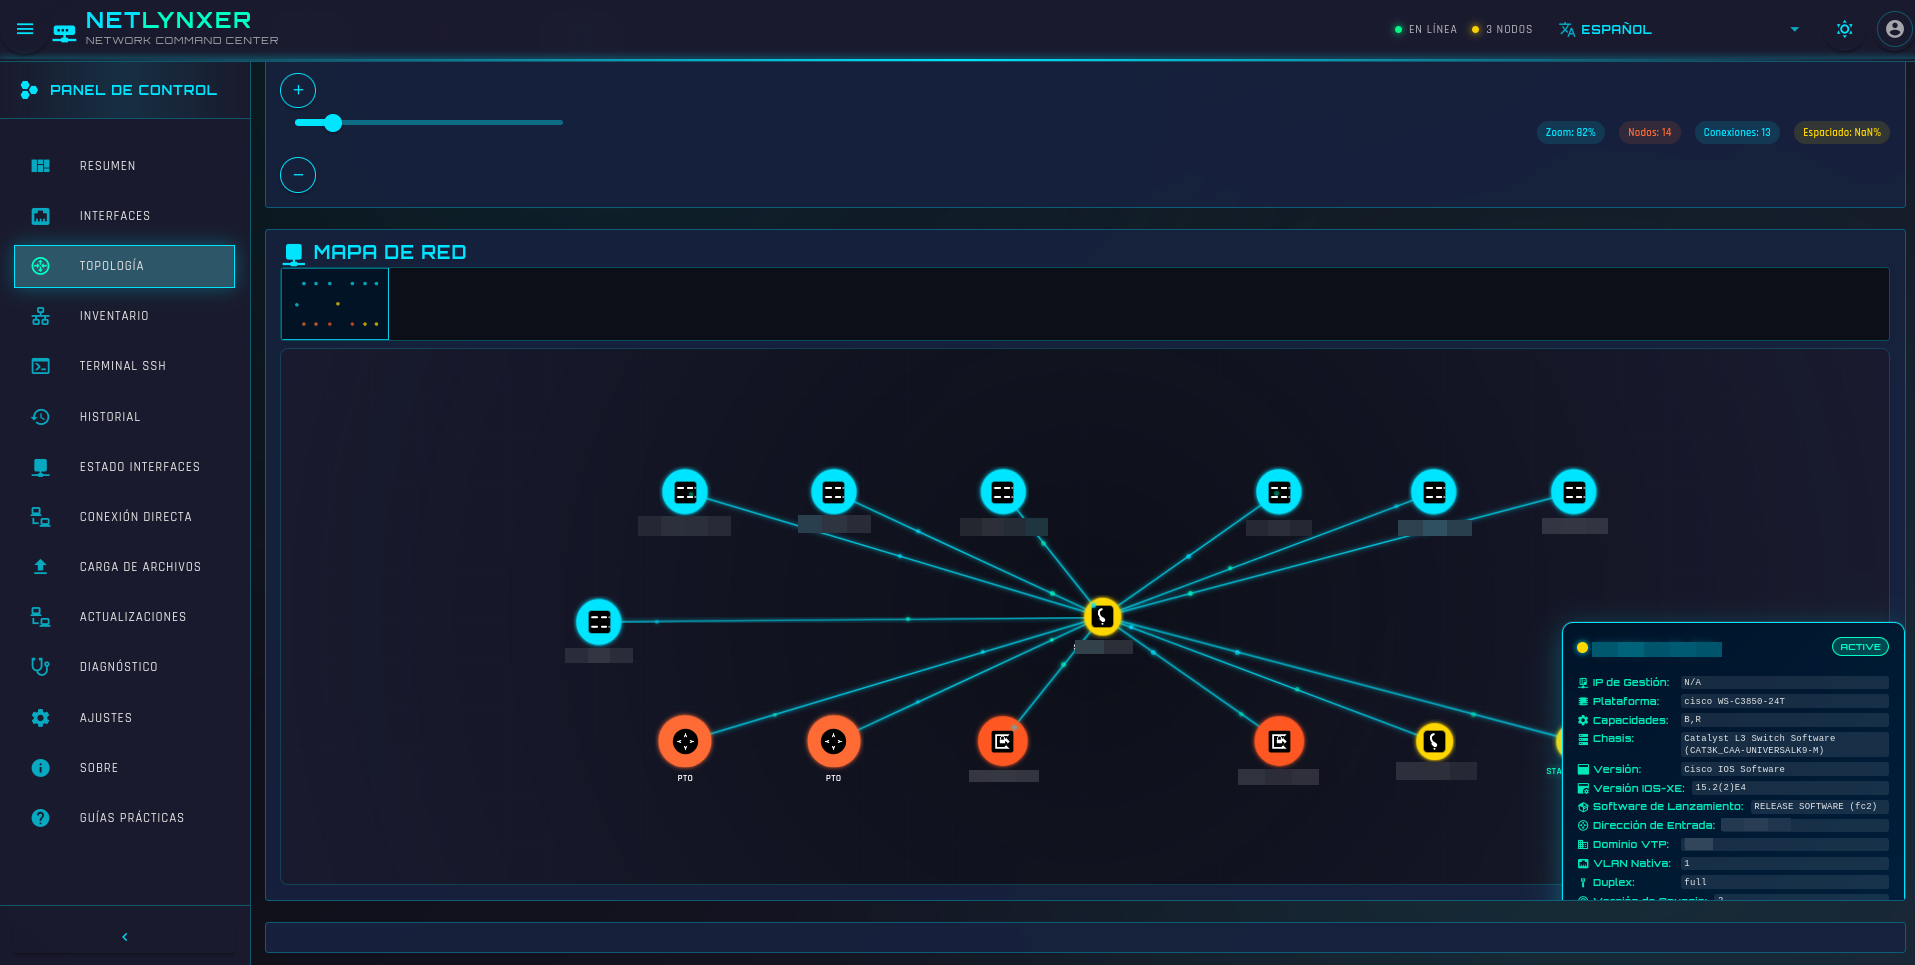
Topology Overview
Topology map from LLDP/CDP discovery on managed devices
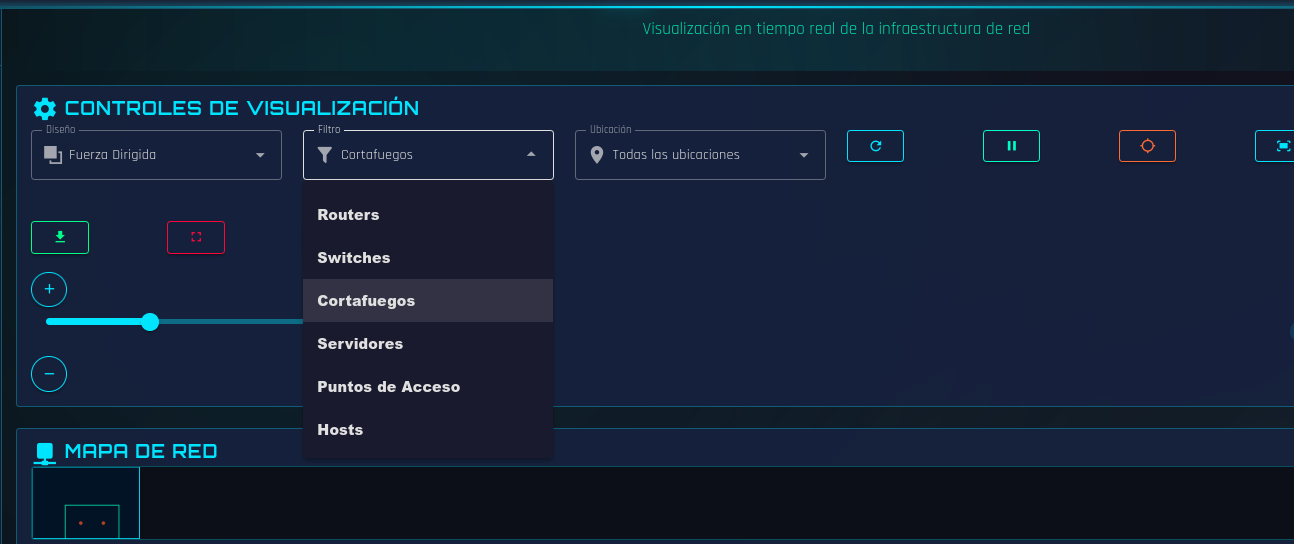
Location and Type Filters
Segmented view by location and device type
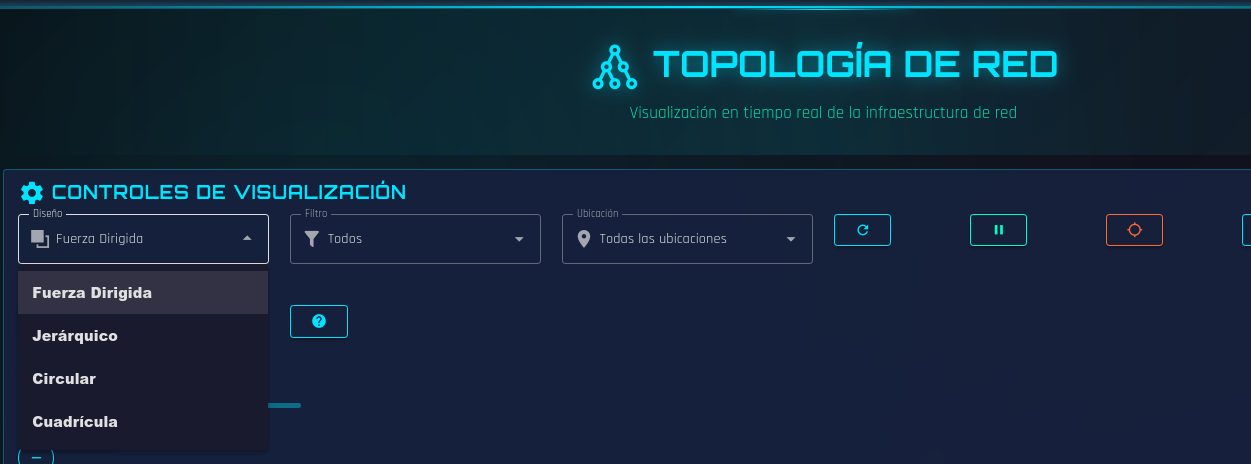
Layout Algorithms
Force, hierarchical, circular and grid layouts
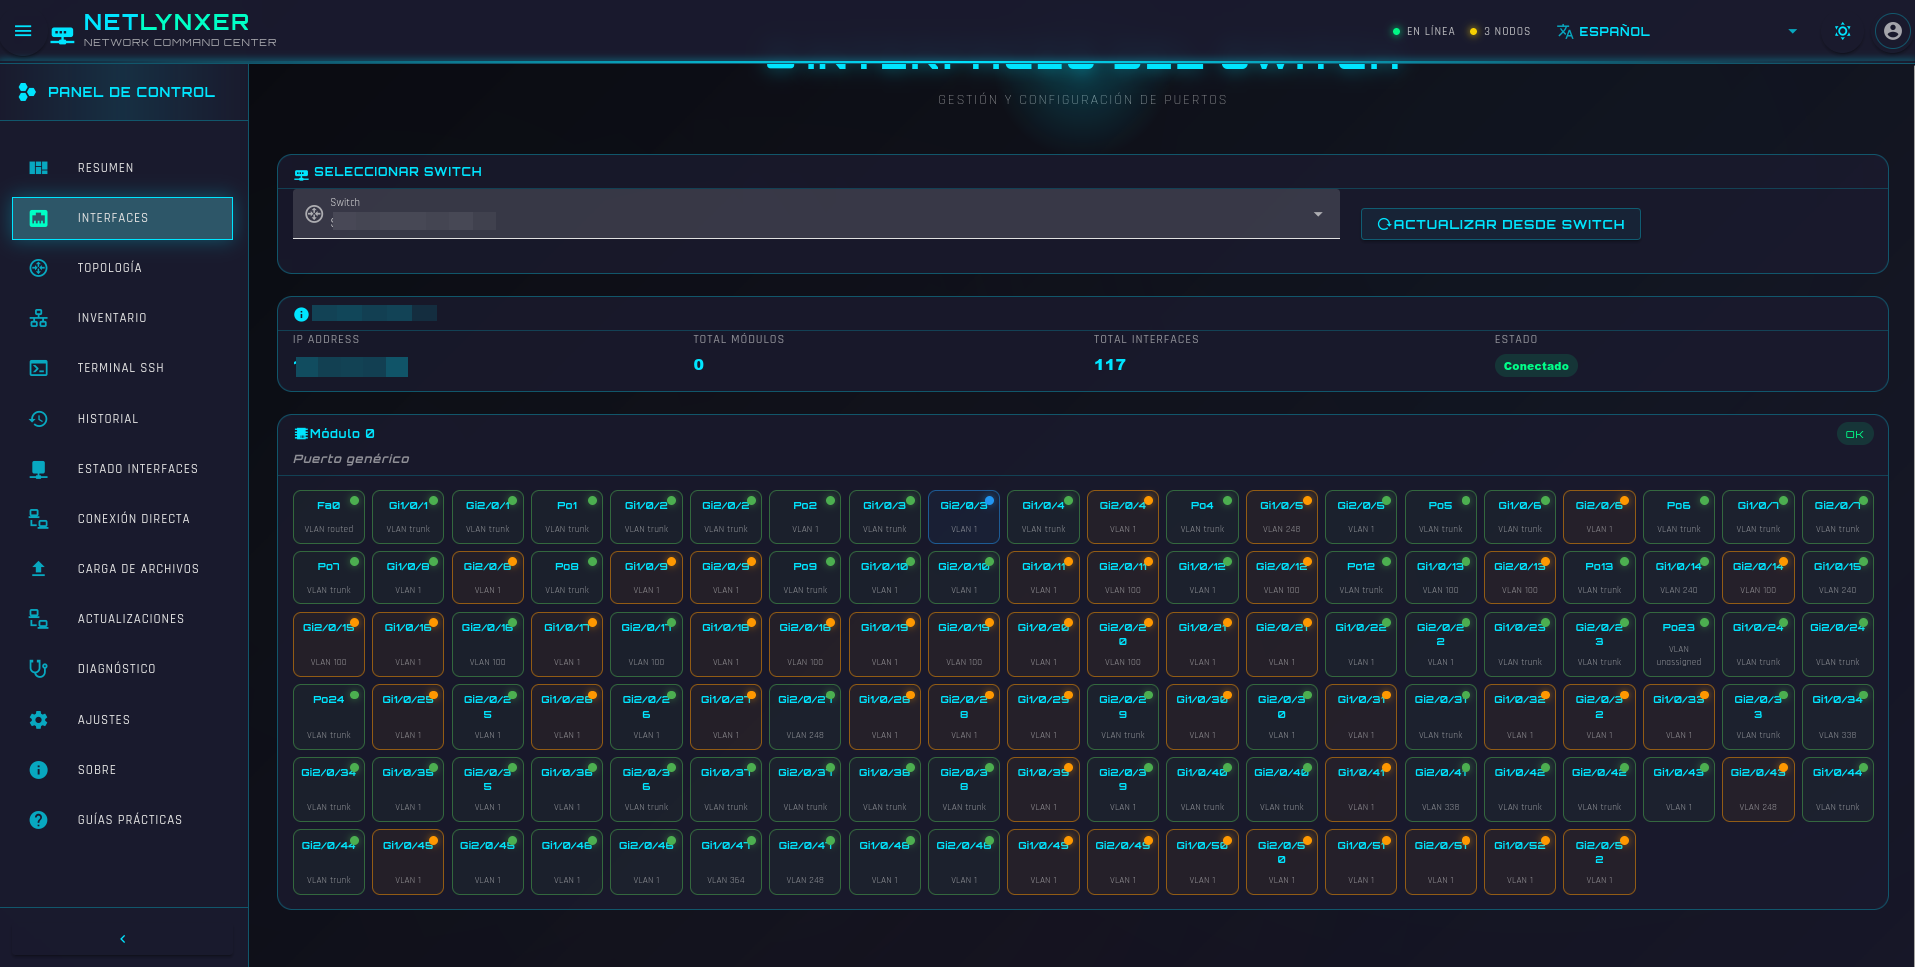
Port Monitoring
Interface status from managed switches
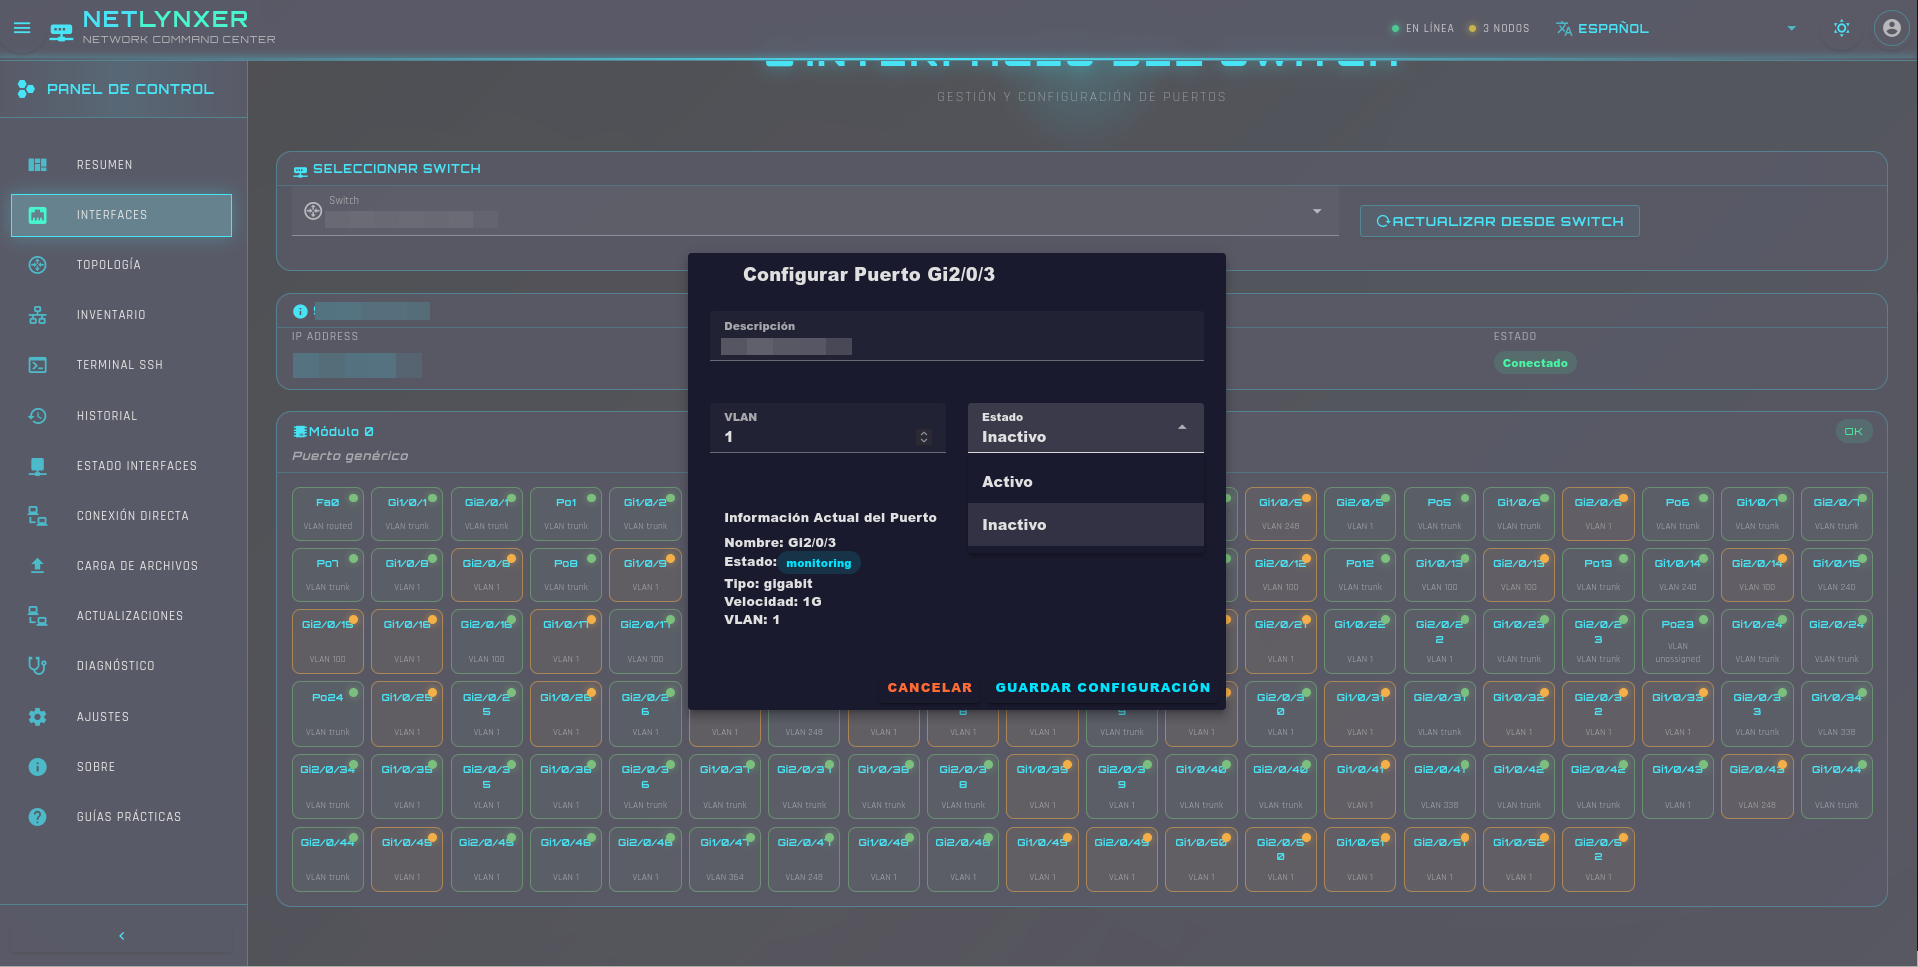
Interface Status
Interface operational state from polling
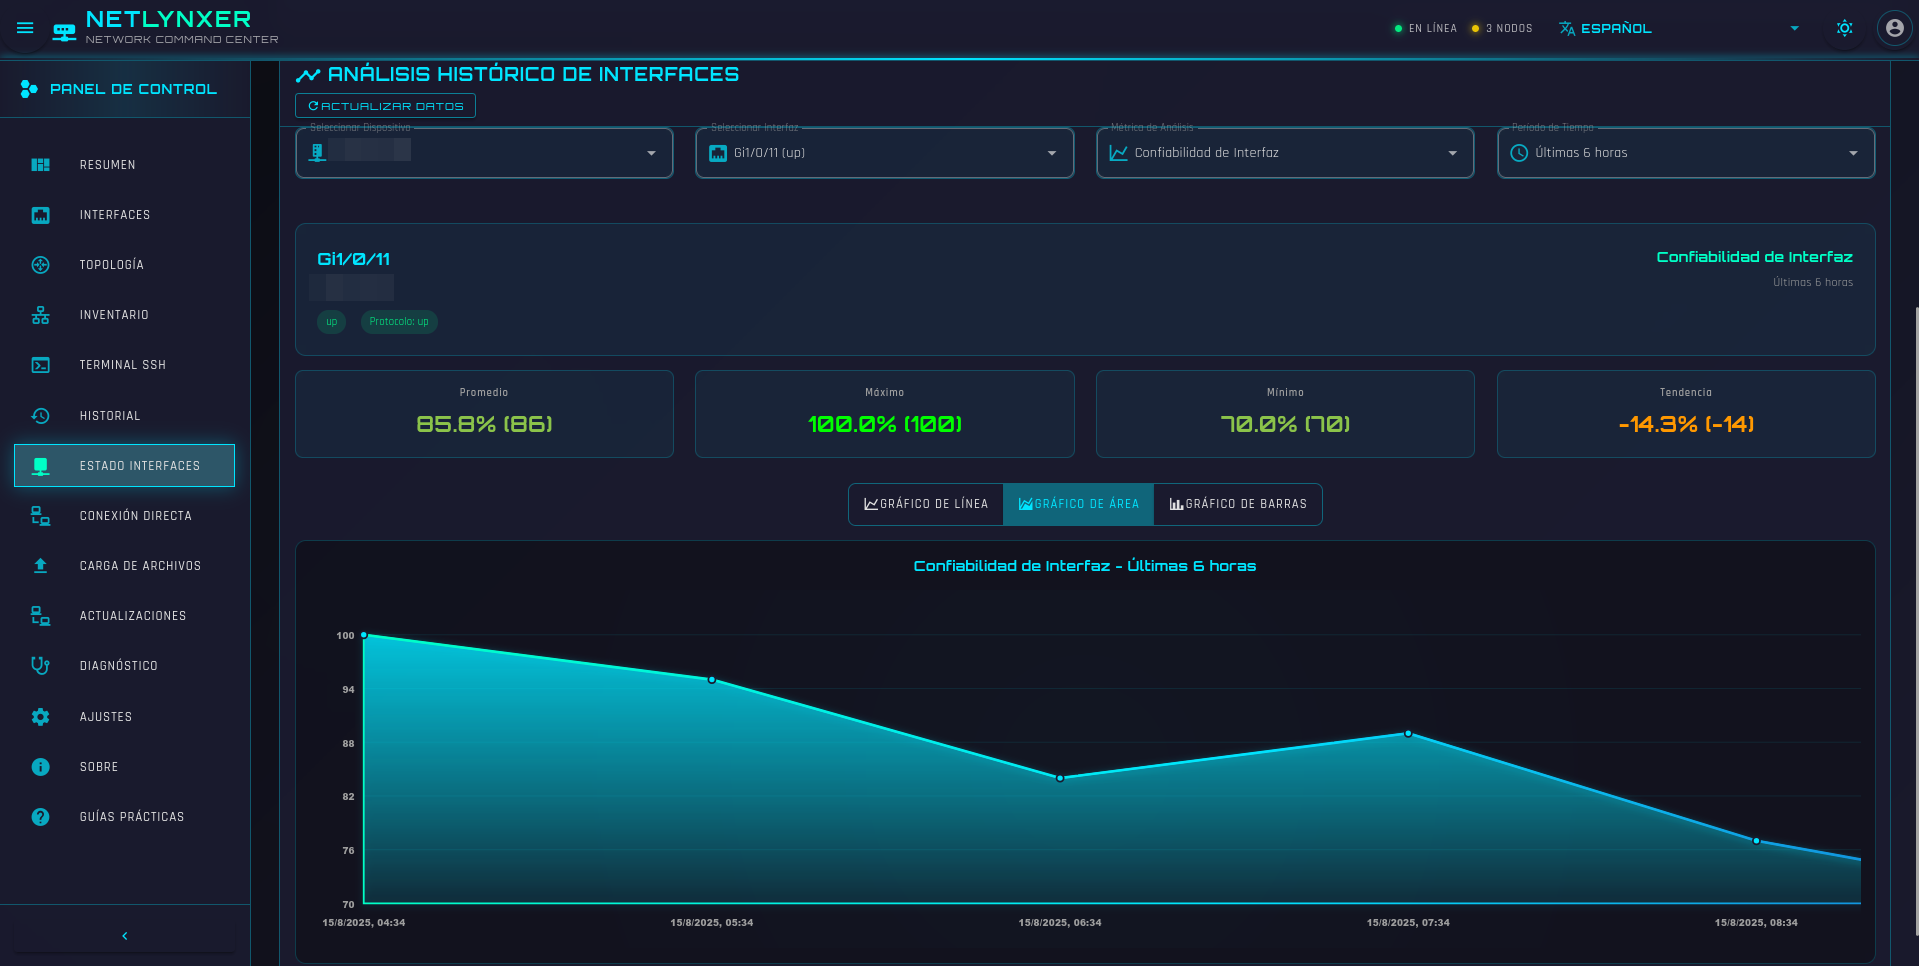
Performance Metrics
CPU, memory and interface metrics where supported
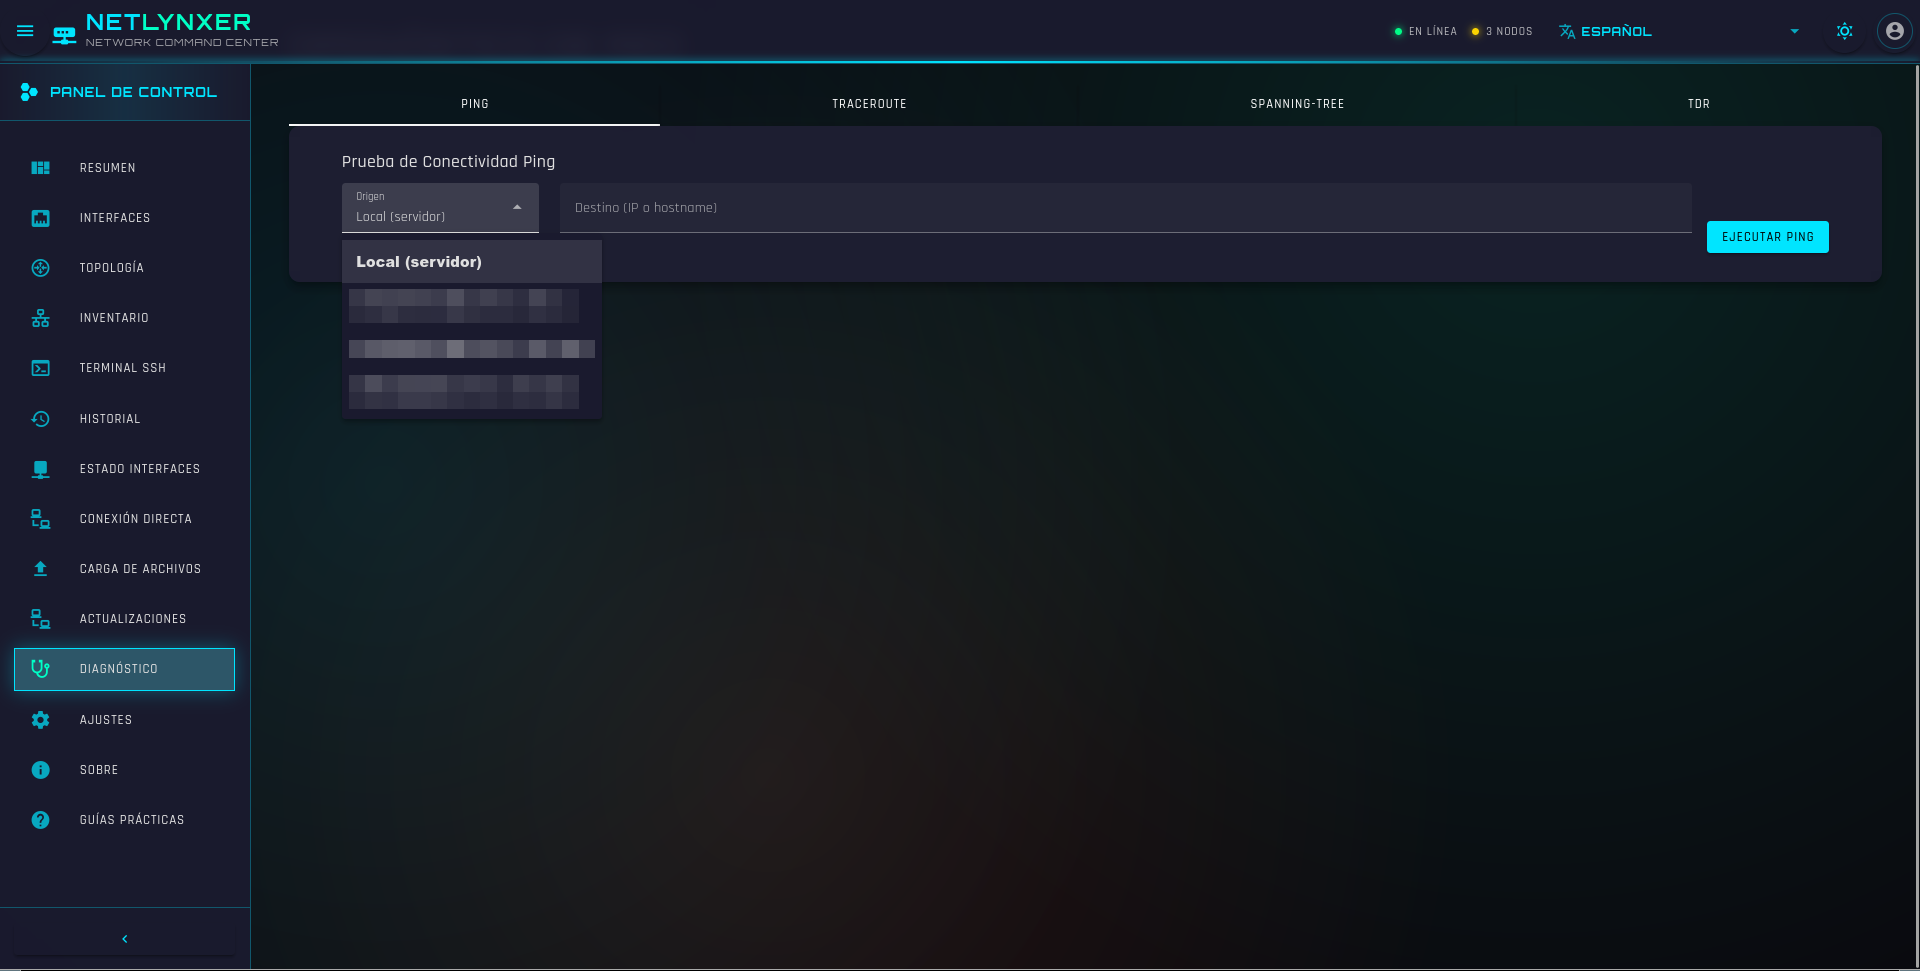
Diagnostics Panel
Ping, traceroute, logging and config tools
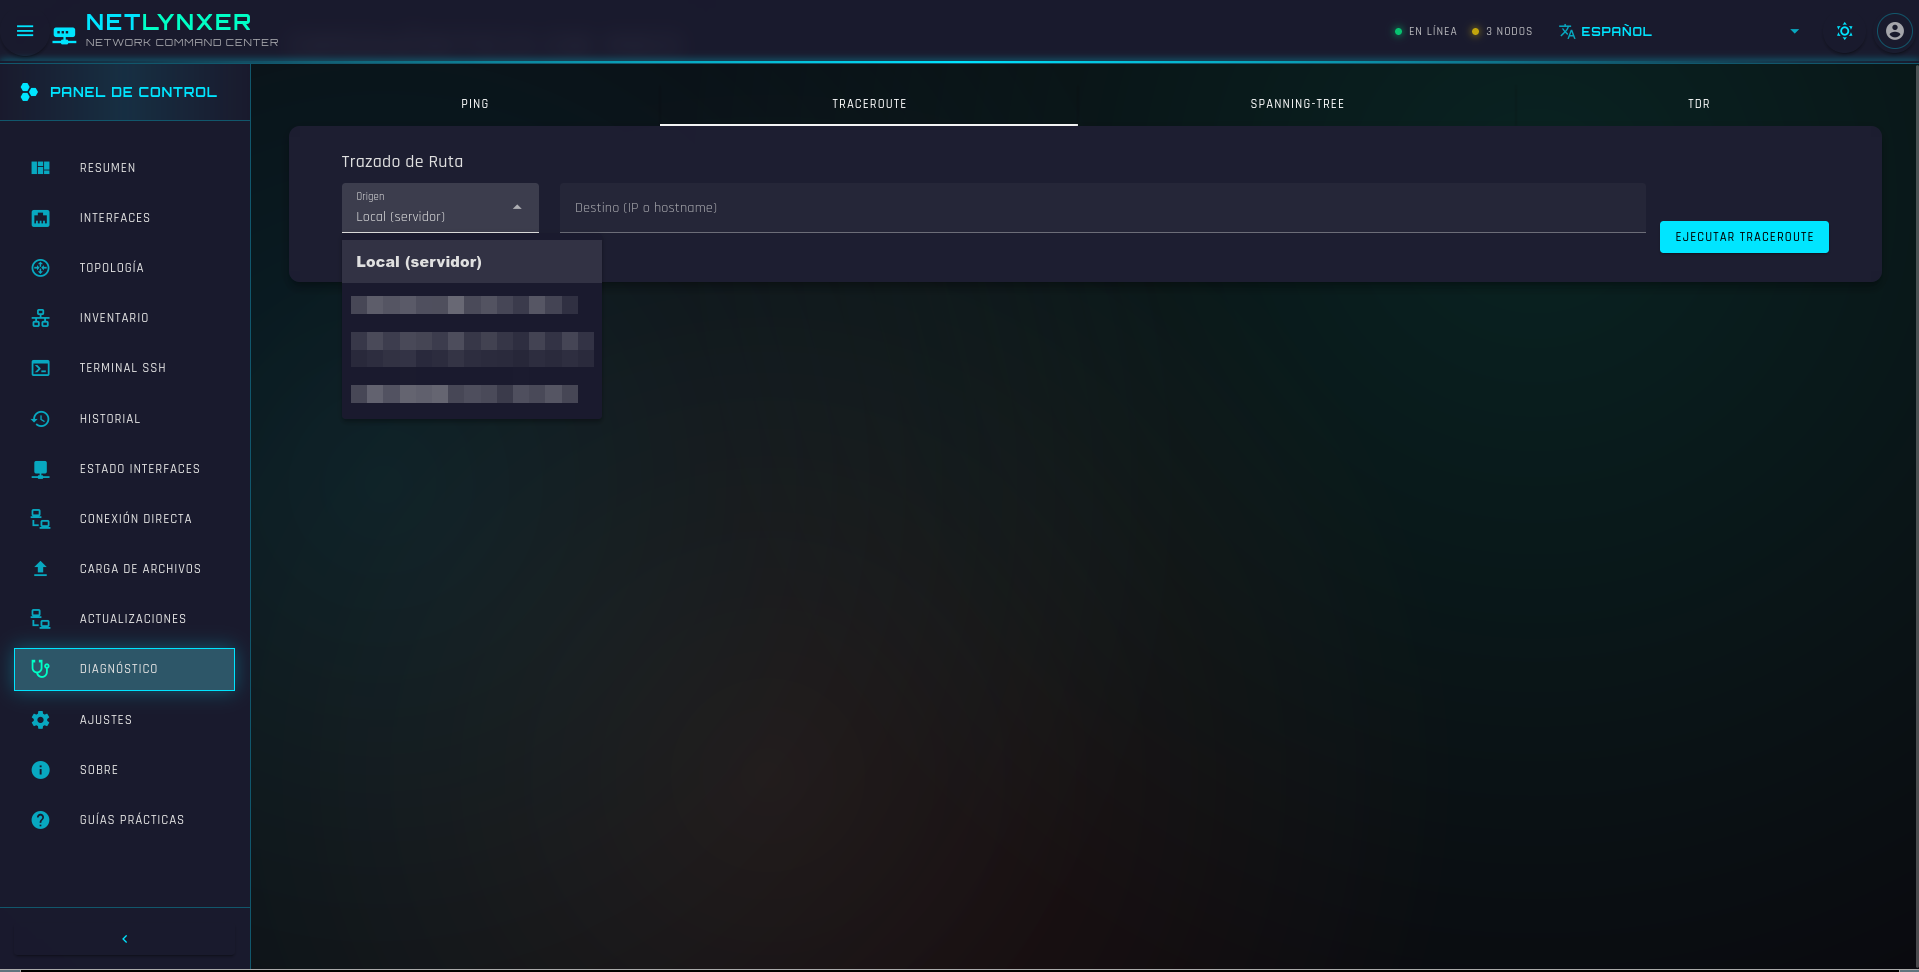
Connectivity Analysis
Connectivity checks from host or device
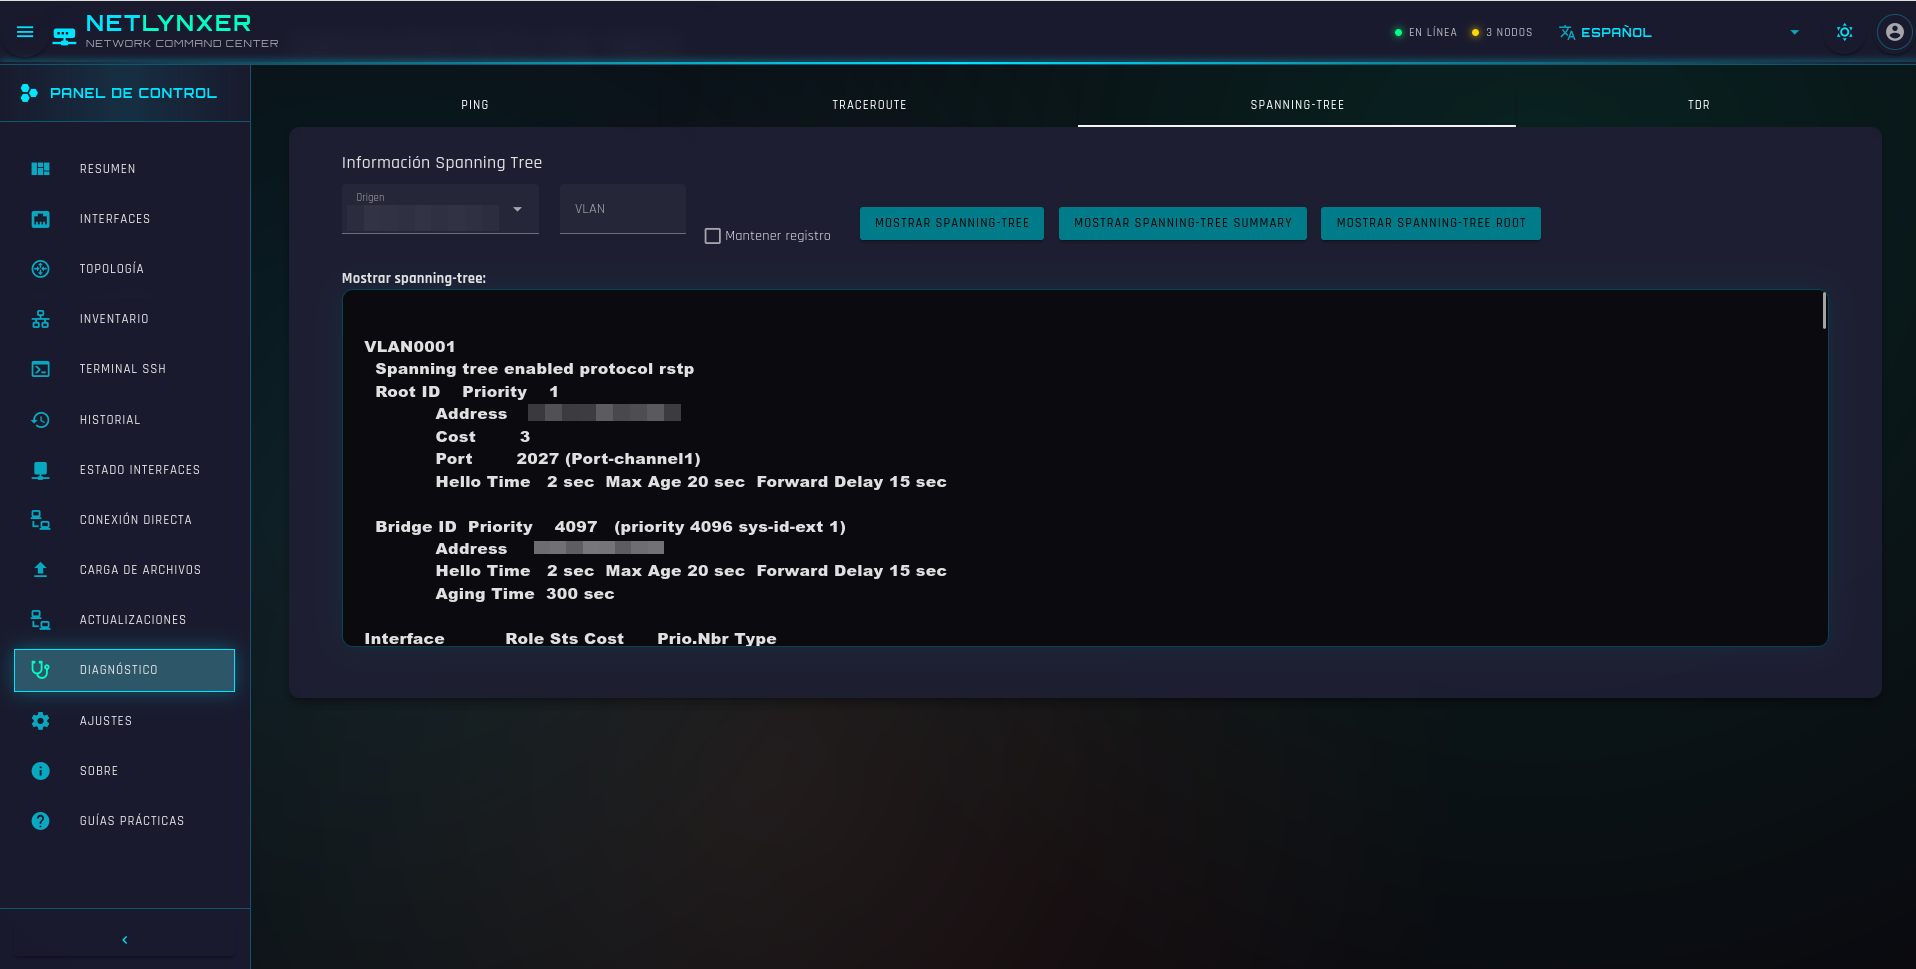
Status Reports
PDF/CSV reports for audits and operations
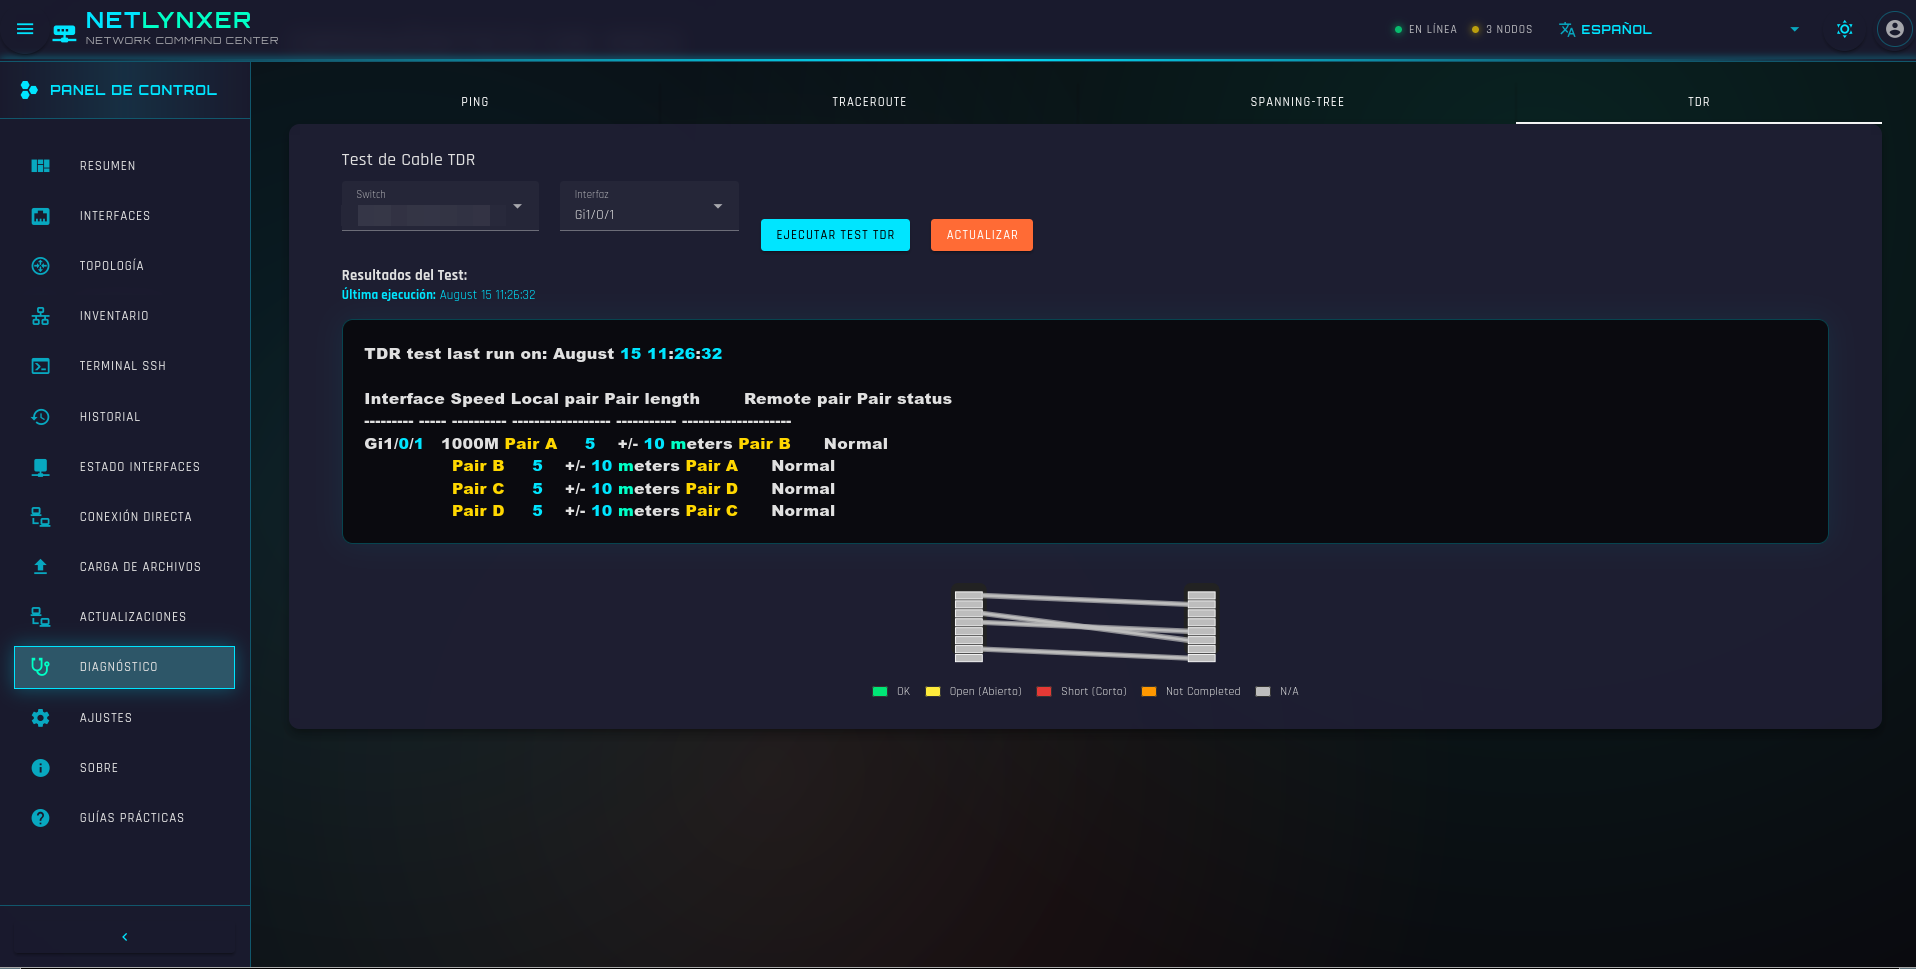
Troubleshooting Tools
Daily ops tools in the same console as inventory
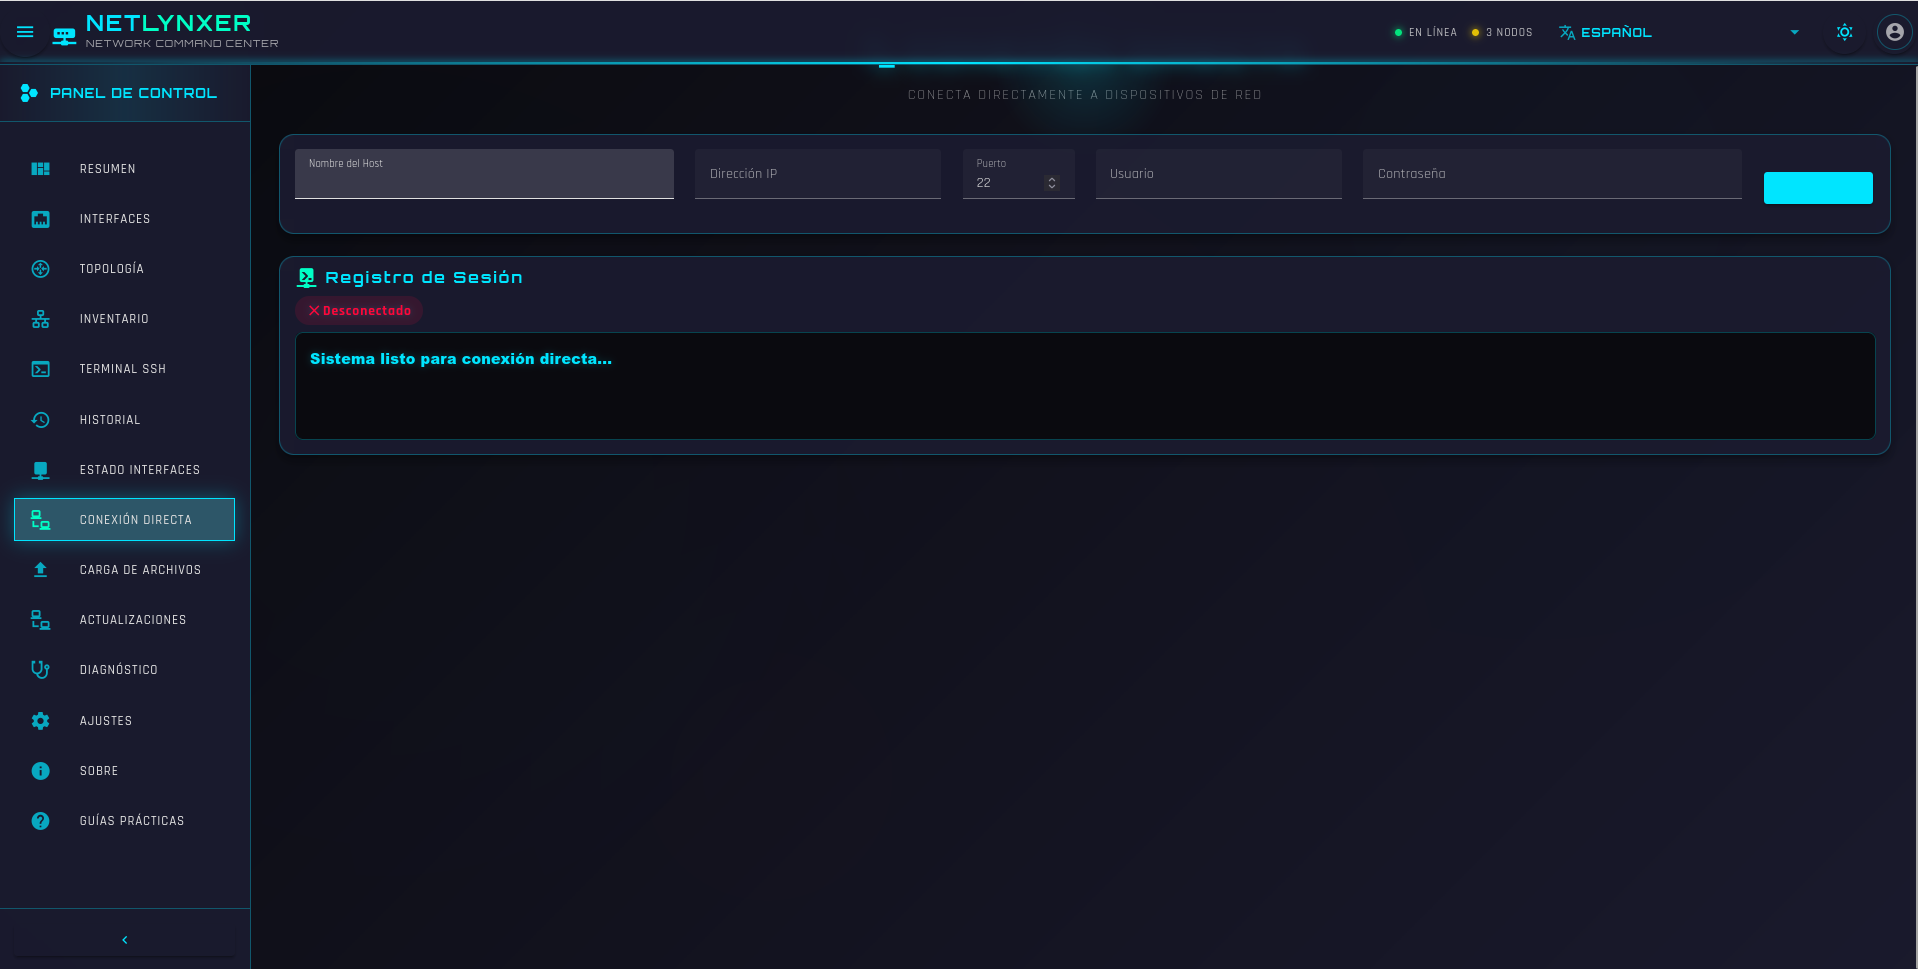
Direct Connection
Reach devices from the web console over your management network
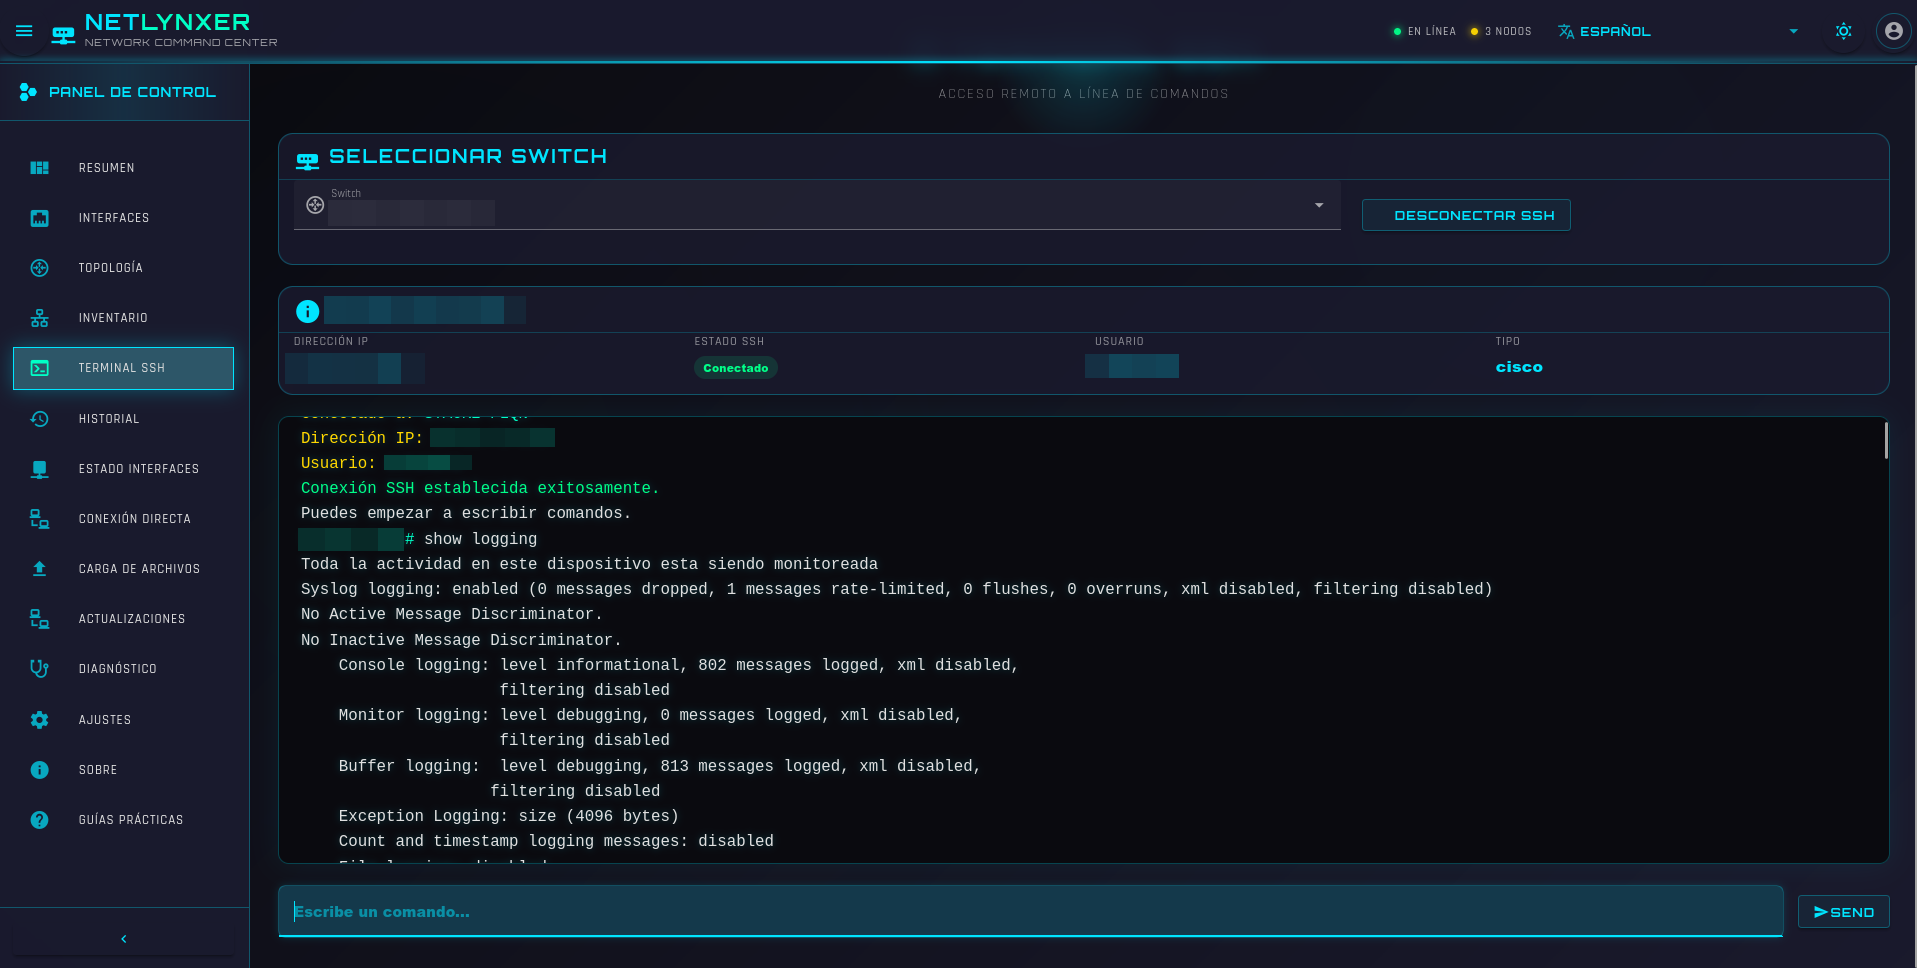
Integrated SSH Terminal
Browser SSH with encrypted device credentials
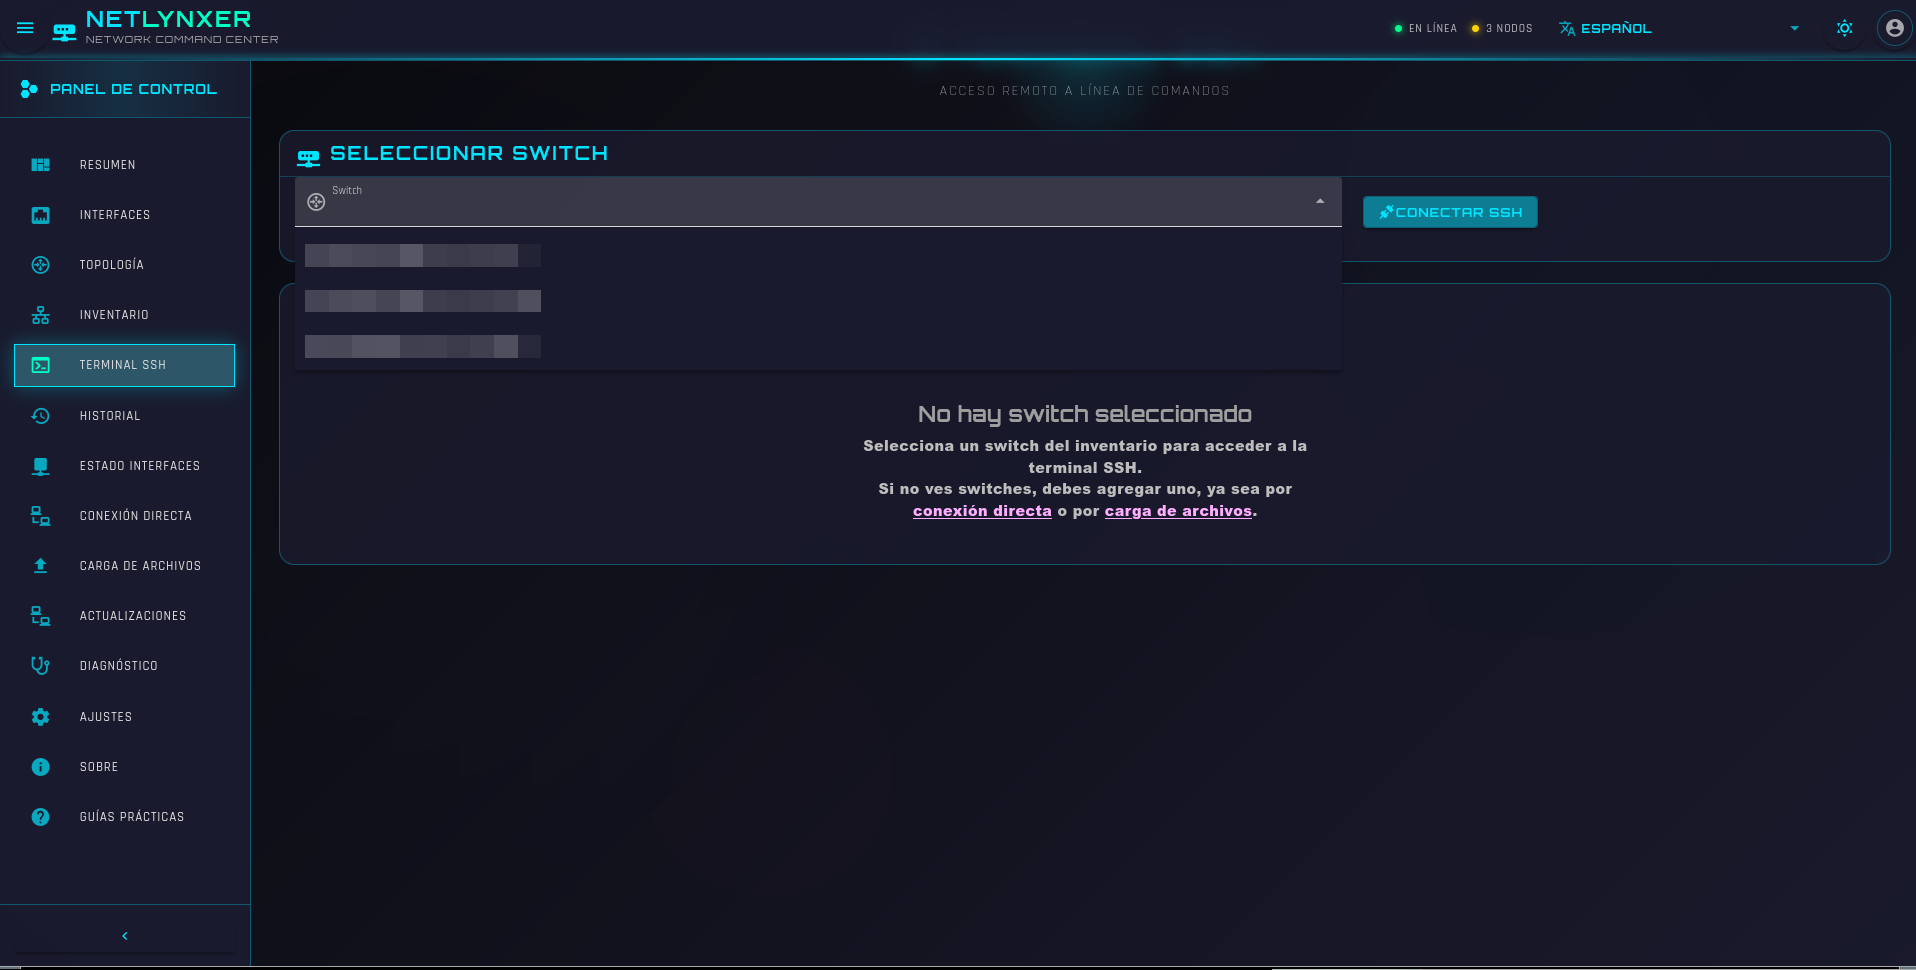
Session Management
SSH sessions with command history
Want to see it on your network?
Request a demo or on-premise PoC. Inventory, map and operations with your devices — data on your infrastructure.